
Slope Calculator
|
By definition, the slope or gradient of a line describes its steepness, incline, or grade.
Where
m — slope
θ — angle of incline |
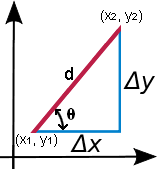 |
If the 2 Points are Known
The Slope Calculator Hides a Deeper Problem Than You Think
A slope calculator returns the rate of change between two points, but the number it gives you is only as honest as the data you feed it. Most users treat slope as a fixed property of a line. It is not. Slope is a local approximation that collapses under non-linearity, and the calculator itself cannot warn you when this happens. The real decision is not whether to use the tool, but whether your two-point comparison deserves the authority you’re about to give it.
Why Two Points Often Lie
Consider a concrete example. A business tracks advertising spend versus revenue:
| Month | Spend (x) | Revenue (y) |
|---|---|---|
| Jan | 10,000 | 45,000 |
| Jun | 50,000 | 120,000 |
EX — Calculation Walkthrough:
Step 1: Identify coordinates - (x1, y1) = (10000, 45000) - (x2, y2) = (50000, 120000)
Step 2: Apply the slope formula $m = \frac{120000 - 45000}{50000 - 10000} = \frac{75000}{40000} = 1.875$
Step 3: Interpret with caution Each additional dollar spent associates with $1.75 in revenue across this interval. Not per dollar. Not causally. The calculator outputs 1.875. Your judgment must supply the rest.
Here’s the hidden variable: interval sensitivity. If you had chosen January and February instead of January and June, you might see m = 0.3 or m = 4.1 depending on the curve’s shape. The two-point slope is not a property of the system. It is a property of your sampling window. This is why economists distinguish marginal rates (derivatives at a point) from average rates (secant slopes). The calculator computes the latter while users routinely treat it as the former.
The asymmetry is stark. A wide interval smooths noise but obliterates local structure. A narrow interval preserves local detail but amplifies measurement error. If you choose monthly granularity, you gain responsiveness but lose signal-to-noise ratio. There is no free setting.
From Formula to Judgment: When the Calculator Misleads
Slope calculators become dangerous when users forget the linearity precondition. In 1973, statistician Francis Anscombe constructed four datasets with identical summary statistics—mean, variance, correlation, and yes, identical slopes—yet wildly different graphical patterns. One is linear. One is parabolic. One contains an outlier that hijacks the entire fit. The slope alone tells you nothing about which world you inhabit.
Edge cases that break naive slope interpretation:
| Scenario | Symptom | Calculator Output | Reality |
|---|---|---|---|
| Vertical line | x1 = x2 | Undefined (division by zero) | Infinite slope; tool fails outright |
| Horizontal line | y1 = y2 | Zero | True, but uninformative about flatness vs. oscillation |
| Single outlier dominates | Normal-looking m | Deceptively stable | Fit is hostage to one point |
| Non-monotonic curve | Consistent sign on m | Hides direction changes | Revenue “rises” on average while actually peaking and crashing |
The outlier case deserves particular attention. Suppose you measure website conversion rate against page load time. Most points cluster: faster loads, higher conversion. One data point—a holiday traffic spike with slow loads but record sales—pulls your slope positive. The calculator says speed hurts conversion. Your business follows this. You are now optimizing toward a statistical ghost.
Practical mitigation: Always pair slope calculation with residual inspection. Compute m, then check whether ∑(yi − ŷi)2 distributes evenly or concentrates at outliers. The calculator won’t do this. You must.
Connected Decisions: What Comes After the Number
A slope calculation rarely stands alone. It feeds into rate-of-return comparisons, elasticity estimates, or trend projections. Each downstream use introduces new failure modes.
If you’re comparing slopes across groups—say, growth rates for two product lines—you face the parallelism problem. Slopes of 2.0 and 2.5 are not “close” in any absolute sense if one series spans 0-10 and the other spans 1000-1010. Normalization by range or mean level becomes essential. The raw calculator output obscures this need entirely.
For projection, the extrapolation trap waits. A slope computed from 2020-2024 data extends forward only if the generative process remains stable. Structural breaks—new competitors, regulatory shifts, supply chain shocks—render historical slopes worse than useless; they become confidently wrong anchors.
| Next Tool/Decision | Why You Need It | Slope Calculator’s Limitation |
|---|---|---|
| Correlation calculator | Assesses strength of linear association, not just direction | Slope magnitude depends on variable scales; correlation standardizes |
| Linear regression | Fits line to many points, not just two | Two-point slope ignores all intermediate data |
| Confidence intervals | Quantifies uncertainty in rate estimate | Point estimate alone implies false precision |
| Change-point detection | Identifies where slope itself shifts | Assumes single constant rate |
The knowledge graph here is clear. Start with the slope calculator for exploratory two-point comparison. Graduate to regression when you have multiple observations. Add inference tools when decisions have material stakes. Never let the calculator’s simplicity seduce you into thinking the underlying decision is simple.
The One Change to Make
Stop treating slope as an answer. Treat it as a question: what relationship between these variables would make this rate meaningful, and what evidence would contradict it? Run the calculator. Then immediately ask what would make its output wrong. That habit—active falsification rather than passive acceptance—separates users who compute from users who decide.